
If you want to make strategic decisions and drive your business to success, you cannot underestimate the power of data dashboards in business management.
“What you measure, improves.”: the famous saying of management guru Peter Drucker, which inspired many entrepreneurs to measure their business performance.
But many companies are missing out on a key part of the equation. Measuring is not enough. Two more steps are needed to translate the data into improvement.
First, your team needs to see the data. And secondly, they need to talk about it and act on it.
Dashboards are the key tools for turning your data into meaningful actions that will boost your performance. They show key performance indicators to employees who can then discuss the company’s progress.
These visual tools give you a clear, at-a-glance overview of business performance, allowing you to monitor critical data in real-time and gain a complete view of your business.
Dashboards are customizable panels that integrate data from different sources, such as accounting software, human resource management, sales, marketing and other business areas.
Through charts, graphs and tables, dashboards provide you with crucial information to make informed decisions and quickly identify trends, challenges and opportunities.
Dashboards also help answer essential business questions such as:
- How many deliveries have we made this week compared to last?
- Which of our three products generates the most revenue? Which items should we promote?
- Where does most of our website traffic come from?
- How do our buyers find us?
- Does our marketing funnel chart work? Is it aligned with the objectives?
Use of data dashboards in business management
This is why the use of dashboards has become indispensable for proper business management:
- Immediate view of key data: data dashboards allow you to view data in a clear and concise way, eliminating the need to analyze lengthy tables or reports. You can easily identify the most important metrics for your business and monitor them constantly.
- Real-Time Monitoring: dashboards update data in real-time, allowing you to monitor performance continuously. This functionality allows you to react promptly to any anomalies or problems, taking the necessary corrective actions to mitigate risks and maximize opportunities.
- In-Depth Analysis: dashboards give you the ability to analyze data at various levels of detail. You can further explore the information displayed, make comparisons between periods, identify the causes of trends and identify areas that require special attention.
- Synthesis of complex data: dashboards make it easier to understand complex data through visual representations. Pie charts, bar charts or heat maps make it easier to interpret information and effectively communicate it to internal and external stakeholders.
- Strategic Alignment: using dashboards, you can maintain alignment of business performance with strategic goals. By measuring key metrics and comparing them to pre-set goals, you can quickly identify any deviations and make the necessary adjustments to stay on track.
But many companies are missing out on a key part of the equation. Measuring is not enough. Two more steps are needed to translate the data into improvement.
First, your team needs to see the data. And secondly, they need to talk about it and act on it.
Dashboards are the key tools for turning your data into meaningful actions that will boost your performance.
They show key performance indicators or KPIs to employees who can then discuss the company’s progress.
A well-designed dashboard not only enables performance monitoring but also engages and motivates your team.
What are the benefits of dashboards?
Dashboards are a critical element for a culture of continuous improvement in any company.
Many companies realize the importance of measuring performance. But many don’t leverage their metrics for communication or troubleshooting.
Dashboards help you do this effectively.
A well-designed dashboard not only enables performance monitoring but also engages and motivates your team.
Dashboards allow you to:
- benchmark, monitor and improve performance
- set goals
- ensure that systems, processes and teams are running at a stable pace, with no abnormal fluctuations
- motivate your team
To get the most out of your dashboards, it’s important to tailor them to your specific business needs.
Define relevant metrics, choose the most appropriate charts, and ensure you have access to up-to-date and accurate data.
How do you create and use a dashboard?
1 – Create KPIs
KPIs are the building block of a dashboard. The key is figuring out the right ones for your business.
One of the most frequently asked questions when we talk to entrepreneurs is, ‘What is the right KPI for my business?'”
The answer is: “Well, it depends. It depends on the direction and priorities of the company. All KPIs must support the strategic and operational direction of the company”.
The decision starts with your strategic goals or operational pain points in your business. You can start with the basics of lean thinking to identify the most important challenges you face. Your goal may be to improve job completion on time, acquire 20% more customers, or capture 10% more market share.
Next, develop a small number of relevant KPIs to measure progress towards the goal. Different KPIs need to be set for each team at various levels of the business, from management to operations.
2 – What are the operational metrics?
Operational metrics are operationally measured KPIs that often give you real-time insight into your progress toward a larger strategic goal.
Let’s say your challenge is to improve customer satisfaction. A KPI could be based on regular customer feedback surveys. This is known as a strategic KPI, because it directly measures progress towards the strategic goal.
Suppose we determine that slow service is behind poor customer satisfaction. A second KPI could be your on-time completion rate. This is an example of an operational indicator, directly related to operations.
Then introduce operational KPIs to help you achieve your strategic goals.
Select the right dashboard for your needs.
A business dashboard is like a car dashboard, a collection of gauges showing the most important information you need to reach your destination.
Performance dashboards come in many forms. It could be as simple as a large physical board put up on a wall in your shop and updated by hand. It could be an electronic screen mounted in a leading place in the industry. Dashboards can also be shared with field employees via a desktop app.
Dashboards with diverse functionality are available from a variety of vendors at reasonable prices. Many offer custom user interfaces, track downtime and other inefficiencies, and offer alerts, notifications, and even intelligence reports. On-premise and cloud versions are also available.
With Industry 4.0 or smart manufacturing technology, it is possible to automate the collection, analysis and visualization of data directly from equipment and machines in real time.
What makes a dashboard suitable?
A dashboard should be:
- Updated often, such as daily, weekly, or monthly, depending on the company.
- Clear and simple, so your team can see KPIs quickly and understand them easily. For example, in a call center, customer satisfaction is strongly correlated with first call resolution. First call resolution rate is a simple and relevant KPI that all agents can understand.
- Manageable: You can start with a couple of KPIs, then later see if adding one or two can help.
- Reviewed regularly, to make sure they encourage behavior that moves the company towards its goals.
How do you create a strategic dashboard?
A strategic dashboard is meant for owners and management. Contains strategic KPIs and potentially sensitive information that is not relevant to all employees. Examples can be financial KPIs such as revenue or profit growth.
How do you create an operational dashboard?
Operational dashboards contain relevant KPIs for a specific department. Each team should have its own operational dashboard with unique KPIs.
Never stop monitoring. Facilitating ongoing discussions using dashboards is a great way to reinforce a culture of continuous improvement.
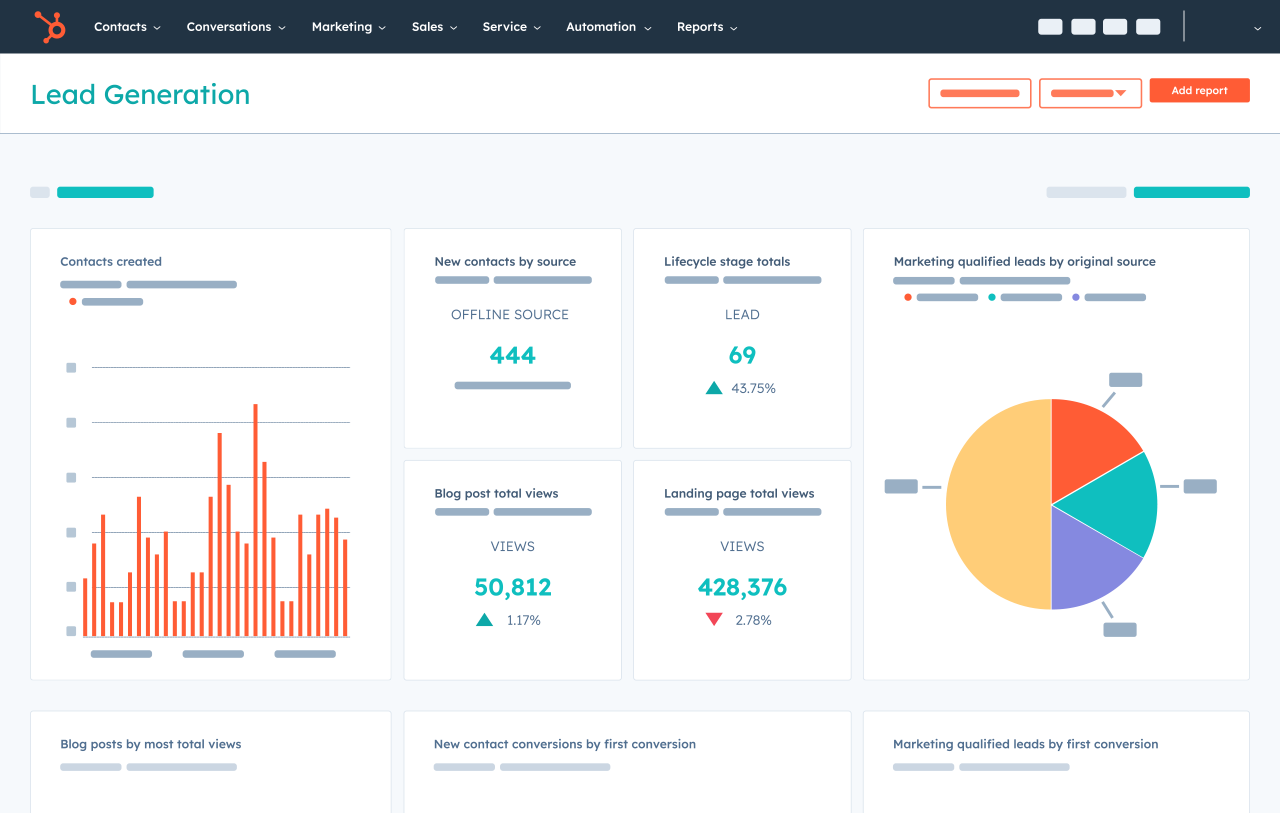
For example, the HubSpot dashboard allows a customization of the purchase repots from the CRM, and depending on the sales and marketing activity, it is possible to monitor the entire lead acquisition and nurturing activity, up to the customer acquisition.
Let’s see an example. You’re probably already tracking marketing metrics like traffic, leads, and customers — these are all key parts of the bigger picture of your marketing funnel.
But they’re not enough to inform and make broader marketing decisions that impact the entire organization. With a CRM like Hubspot, you can create very specific marketing reports based on your role.
Marketing reporting is the process of collecting and analyzing marketing metrics to inform future marketing decisions, strategies, and performance. Marketing reports reveal meaningful, actionable data that helps you draw important conclusions and achieve organization-wide goals.
Think of marketing reports as an essential snapshot of your business. It helps you to:
- Determine which marketing channels work best for your business
- Discover the gaps in your marketing strategy
- Promote more marketing budget and headcount and reallocate the marketing budget
Another example is given by the dashboard of Kiosk Varco, our application for the complete management of the company visitor.
The Kiosk Varco dashboard offers synthetic indexes of analysis of the flow of visitors in the company and allows you to monitor the behavioral habits of visitors with just a few clicks.
The dashboard of Kiosk Hydra offers a snapshot of the workload of the teller operators in the various offices and an analysis of the average stays of the users in the office.
The extremely accurate reporting allows you to monitor the KPIs and therefore to optimize the flow of users.
3 – Continue to monitor your dashboard
Supervisors and employees should meet regularly to discuss the dashboard that is relevant to their team. Discuss what is going well, what is not going well and opportunities for continuous improvement.
The mantra is therefore :”Never stop monitoring”.
“Remember, facilitating ongoing discussions using dashboards is a great way to reinforce a culture of continuous improvement.” – Anish Ambujakshan
More tips:
- Employee input is invaluable in ensuring the right KPIs and dashboards are chosen. This input also helps ensure your team’s buy-in for using the dashboard.
- Goals should be achievable and realistic. Challenging your team is helpful, but setting goals that employees struggle to achieve is daunting.
- KPI data should be easy to obtain. Also dedicate someone to be responsible for metrics collection and reporting.
- Train employees on monitoring KPIs and using the dashboard.
- Use dashboards in conjunction with other management tools, such as employee performance reviews and incentives.
Data dashboard and digital signage displays
Modern digital signage displays are ideal for showcasing business dashboards. They enable employees, executives or other stakeholders to view real-time metrics and performance on screens located in offices, meeting rooms or other relevant locations.
This integration between dashboards and digital signage displays can increase visibility and awareness of business performance, improving internal communication and strategic alignment. It can also lead to greater transparency and employee engagement, as key information is accessible and visible to all.
In conclusion
Making decisions based on data is essential. A data dashboard is a tool used by many companies to track, analyze, and visualize data, usually to gain insights into the overall well-being of a specific organization, department, or process.
Dashboards are designed to help you detect changes within a business, both good and bad, often in real time. If you can detect new developments as they happen, you have the opportunity to quickly change course of action if needed, or even anticipate emerging trends.
Our software platforms, Kiosk Hydra, Kiosk Varco, Kiosk Emoticon provide advanced reporting for the management of user flows and the degree of customer satisfaction: elements of important innovation with a view to optimizing processes and costs.
As a HubSpot Solution Provider we provide everything you need to onboard this all-in-one CRM platform for marketing, sales and customer service.
If, on the other hand, your company’s need is to have an ad hoc dashboard, our team of developers and system integrators is able to study a specific solution for analyzing and visualizing your data.
 |
Talk to one of our experts.If you want to get a clear and immediate view of business performance, make informed decisions and drive your business to success, don’t miss the opportunity to adopt dashboards today! Leverage the power of visual data and intuitive charts to monitor key metrics, spot trends, identify opportunities and mitigate risks. Take the first step towards more effective business management and take control of your success. |
|
Talk to one of our experts.If you want to get a clear and immediate view of business performance, make informed decisions and drive your business to success, don’t miss the opportunity to adopt dashboards today! Leverage the power of visual data and intuitive charts to monitor key metrics, spot trends, identify opportunities and mitigate risks. Take the first step towards more effective business management and take control of your success.
|


