
In the ever-evolving digital world, user experience (UX) has become a crucial element for business success. Companies that strive to deliver intuitive, delightful, and satisfying digital experiences are often rewarded with loyal customers, increased conversions, and improved revenue.
However, to achieve and maintain a competitive advantage, it is not enough to simply design an attractive user interface; we must constantly evaluate and optimize the experience we offer our users.
In this context, UX metrics emerge as an indispensable tool, providing a detailed overview of user experience performance and guiding business decisions aimed at improving customer satisfaction and sales results.
There are several metrics to measure user experience, and each metric indicates a different part of the user experience. But before we dive into which metrics you should choose for your business, let’s take a look at UX metrics and how to use them.
Index
• What are UX metrics?
• UX Metrics You Should Be Measuring
• Best practices for measuring UX
What are UX metrics?
Understanding the importance of quality data in the context of sales and marketing is crucial. Accurate and complete data provides a solid foundation for planning future sales and marketing strategies. However, it is equally important to look beyond the marketing data and consider the human interaction with the product or service offered. Your marketing efforts may be flawless, but if the user experience is poor, all your hard work can be wasted.
This is why UX metrics become crucial.
UX metrics are quantitative and qualitative data points that are collected to track, measure, and compare user experience on a website or application. This data reflects the attitudes and behaviors of real people.
Measuring user attitudes and behaviors can be a complex task, but this can be done through indicators such as how often a user clicks on a certain link, how fast pages load, or how long it takes to complete an action.
Carefully examining UX metrics provides a high-level overview of users’ overall experience with your product or service. These metrics are critical to aligning customer satisfaction with business goals. Finally, they should serve as a guide for product or service updates and improvements to increase overall customer satisfaction.
When focusing on customer experience and the metrics to monitor, it is important to understand that it is not necessarily just about measuring KPIs, which are the key performance indicators that evaluate the overall success of the business strategy.
Undoubtedly, user experience and customer satisfaction significantly influence the overall success of the company. However, UX metrics offer a more detailed and specific view of the user experience.
UX metrics are commonly divided into three categories:
- Descriptive Metrics: These metrics reflect the behavior of users when they use your product or service. They measure things like frequency of use, actions taken by users, and paths followed during interaction.
- Behavioral Metrics: These metrics focus on user interactions with your service or product. They closely analyze specific actions such as page clicks, downloads, or other actions relevant to your industry.
- Attitude Metrics: These metrics describe the overall perception or attitude of users when interacting with your product or service. They measure users’ feelings, opinions and satisfaction levels.
UX metrics serve as an indicator of what needs to be improved to make your product or service more intuitive and customer-friendly. Improving customer experience not only leads to increased satisfaction, but can also lead to improved business KPIs.
UX Metrics You Should Measure
Below are four essential UX metrics you should be tracking to gain a complete view of your customer experience.
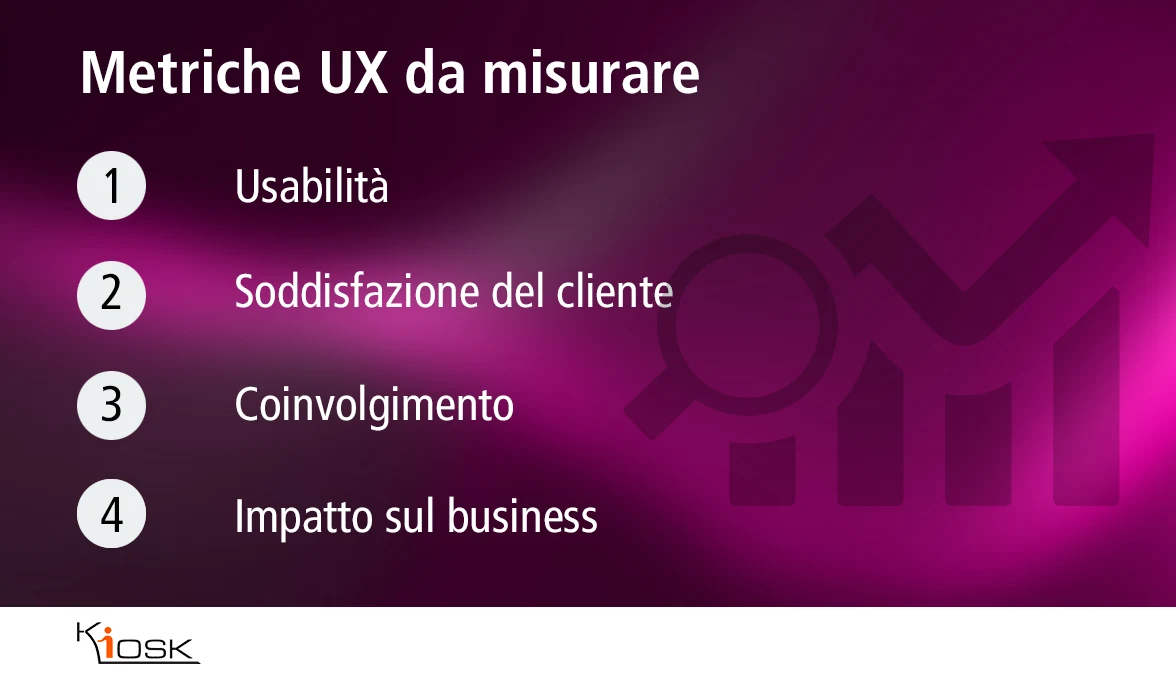
1. Usability
Usability is how easy it is for users to interact with your product or service to achieve their goals. Measuring usability means evaluating how intuitive, efficient, and enjoyable your product is to use. This may include website navigation, accessibility of key features, and the clarity of instructions provided to users. Monitoring and improving usability can reduce user learning time, increase user productivity, and reduce frustration, leading to a better overall experience.
To test usability, you might have a select group of users complete a task within your product. An observer observes, records, and compares the behavior of users completing the task.
The data you collect for this metric will help you determine the efficiency and effectiveness of your product or service.
There are several ways to measure usability, and how you measure it depends on your product or service. However, here are some common UX metrics for usability.
Efficiency
If you want to know how well a feature works within your product, a critical UX metric to consider is efficiency.
If you want to know how well a feature works within your product, a critical UX metric to consider is efficiency.
You should measure:
- Activity completion rate. Calculate this by averaging the time it takes test users to complete a task and dividing the average by the total number of participations. This UX metric is useful to know and track when making changes and updates to your product.
Tip: You can compare the task completion rate times of experienced users with new users. Use the expert user’s data points as base data. - Success score. This metric reflects the question: “Were users able to complete a set task?” Calculate the success score by dividing the number of tasks completed by the total number of attempts. The higher the number, the higher the success rate of users testing your product.
- Number of errors. This UX metric can measure the total number of errors or individual errors. To calculate this, we recommend dividing the total number of errors by the total number of possible errors.
Effectiveness
Effectiveness measures whether users are able to fully complete the designated goal. Like efficiency, you’ll also want to measure effectiveness if you’re updating or improving your product or service. Ideally, you should measure effectiveness before making any changes so you have baseline data to compare future data sets against.
2. Customer satisfaction
Customer satisfaction is a measure of users’ overall perception of your product or service.
Customer satisfaction metrics are both qualitative, meaning you can collect data from your customers by asking open-ended survey questions, and quantitative. The data you collect will help you understand what your product is doing well and poorly, and what can be improved.
Fortunately, there are several metrics to consider when measuring customer satisfaction.
This can be assessed through surveys, reviews, direct feedback, and other qualitative metrics.
Increased customer satisfaction indicates that your product meets users’ needs and expectations, increasing the likelihood of brand loyalty and advocacy.
Monitoring customer satisfaction is essential to identify any problems or areas for improvement and to maintain a high level of user trust and satisfaction. If you are looking for a software to measure customer satisfaction, discover Kiosk Emoticon.
Customer Satisfaction Score (CSS)
Collect this data by sending a survey to all your users. You could collect data through a survey pop-up that asks users to rate their experience using the emoji graph or by choosing a number on the scale.
Be sure to include open-ended questions in your survey. This will give users the opportunity to provide feedback. Once you have collected enough data, you will have a good indicator of customer satisfaction.
Single Ease Question (SEQ)
This one-question survey typically asks, “Overall, how difficult was this task?” The Single Ease Question believes that the task completion time metric may be inaccurate. Users may have legitimate reasons for completing a task at a slower pace.
By asking this question, you will understand the ease of activities within your product. Users should choose the best answer for the task difficulty based on their experience. Typically, one means that the task was very difficult, and ten represents that the task was extremely easy.
Net Prompter Score (NPS)
Use this metric to determine your customers’ loyalty to your product or service. This metric is also easy to decide. Simply ask your customer base, “How likely are you to recommend this product to a friend or colleague?” The higher the number, the more loyal your customers are.
In this article, you will find a guide on how to measure NPS.
Customer Churn Rate (CCR)
Determining your churn rate is a good indicator of how well your customers are receiving your product. Churn rate reflects the number of customers who immediately leave your website.
To calculate this rate, you will need to define a time frame. For example, you might only want to look at a six-month window. Then, subtract the number of customers at the end of the period from the number at the beginning. Then, divide that number by the number of customers at the beginning of the time period. This number is your churn rate.
3. Involvement
Engagement measures how actively users engage with your product or service. This can include metrics such as time spent on site, number of pages visited, actions taken by users (such as clicking links or sharing on social media), and other behaviors that indicate an active interest in your brand.
A high level of engagement can indicate a strong affinity for your product and an overall positive experience.
The number of page views your website receives in a designated time frame is a simple metric for determining engagement. Start monitoring this parameter for several months.
The first month’s data will form the baseline data point. Ideally, you want to see a trend of increasing page views. If the trend turns negative, it means that your customers are no longer engaging with your content.
Session duration
This metric is also a good indicator of engagement. Session duration measures the time customers spend on your website or page. An engaged customer will spend more than a few seconds interacting with your content. If your session duration metric is low, you know you have a small problem to fix.
4. Impact on business
Business impact measures tangible results that result from user experience, such as increased conversions, revenue, or market share.
These metrics directly link user experience to business outcomes and demonstrate the value of investing in user experience optimization.
Tracking business impact helps you assess the return on investment of your UX improvement initiatives and make informed decisions to maximize business value.
If the user experience is poor, your business will likely see a decline in revenue. Instead of leaving it to chance and hoping that your product’s user experience is good enough, there are ways to measure the business impact of customer experience.
With data in hand, you can make appropriate changes or modifications to your product or service to ensure that the user experience has a positive impact on your business goals.
To measure business impact, take a look at these metrics (again, this is not an exhaustive list of metrics you can measure for business impact).
Conversion Rates
Conversion rates are a good indicator of the business impact of user experience. If you offer a product or service with an additional upgrade, you can measure how many users switch to the paid product, don’t.
Depending on the result, you can determine whether you need to make any changes to improve the user experience.
Revenue and sales
You will need a baseline number for sales and revenue to accurately account for this metric. Track your sales after each update or improvement to determine how those updates affect your overall revenue.
Customer Lifetime Value (CLV)
Customer Lifetime Value measures how valuable a customer is to your business.
Meaning: How much money does each customer spend with your company?
In general, older customers are less expensive to retain than to gain new ones. Therefore, try to retain these acquired customers.
ROI
Every company should be accustomed to measuring return on investment. To determine how ROI is impacted by user experience, compare the total amount of time, effort, and money spent on user experience versus the overall activity.
This will give you a good idea of how user experience impacts your ROI.
Measuring UX metrics and keeping up with the data can seem overwhelming. However, there are tools, like HubSpot’s Customer Journey Analytics tool, to help you track and compare UX metrics data.
In summary, these four metrics—usability, customer satisfaction, engagement, and business impact—provide a complete and balanced view of the user experience and its impact on business success. Closely monitoring these metrics and taking corrective action when necessary can help ensure a superior user experience and drive long-term positive business outcomes.
Best Practices for Measuring UX
Best Practices for Measuring UX After all, your customer experience is a critical factor in the success of your product. There are numerous UX metrics to measure, but not all metrics will provide valuable insight into your business.
Consider these best practices and tips to get the most value from your UX metrics.

1- Set measurable goals.strong,
Before measuring any part of the user experience, you should set clear, measurable goals. Your goals will ultimately help you choose the best metric to measure.
For example, if you want to increase user velocity through a contact form, you can first determine the task completion rate.
Using this information, you can select a reasonable goal and the means to measure it.
Pro Tip: Writing your goals using the popular SMART method will help ensure that your goals are specific, measurable, attainable, relevant, and time-bound.
2 – Get the basic data.strong,
The point of UX metrics is to determine what part of the user experience is missing. This way you can work to improve the overall experience.
But before you make improvements, you should first collect baseline data. The baseline data will be your benchmark for comparing a change in user experience based on changes you make to your product or service.
Pro Tip: Make sure you set a specific time period for each metric you want to measure. Once you have established your time frame, stick to it throughout your testing. This will give you an accurate data set.
3 – Measure multiple UX metrics.strong,
When determining user experience, it’s always a good idea to look at the user experience and measure multiple UX metrics. One metric won’t give you a good read on the user experience. You need a diverse data set to give you a clearer picture.
Pro Tip: Choose multiple UX metrics to give your business a clear understanding of the user experience.
4 – Measure for qualitative and quantitative metrics.strong,
Qualitative metrics, like customer feedback surveys, can sometimes tell you more than a single number. Qualitative metrics enable an open discussion between you and your customers. For example, a survey lets you learn about customer pain points and potential solutions.
An example of a qualitative UX metric could be the “Net Promoter Score” (NPS). NPS is a measure that evaluates customer satisfaction and loyalty through a single question: “On a scale of 0 to 10, how likely are you to recommend our product/service to a friend or colleague?” Users are divided into three categories based on their response: promoters (votes 9-10), neutrals (votes 7-8) and detractors (votes 0-6). The NPS score is then calculated by subtracting the percentage of detractors from the percentage of promoters.
Quantitative data, on the other hand, is also essential.
This type of data will provide a solid understanding of performance relative to business goals. You need both of these types of metrics when you’re looking at user experience.
An example of a quantitative UX metric might be “Average Page Load Time”. This metric measures the average time it takes to fully load a web page on a user’s browser. A shorter loading time is generally associated with a better user experience, as users tend to be more impatient and inclined to abandon a website if pages take too long to load.
To collect data on this metric, you can use website tracking tools that record the loading time of each page visited by users. This data can be analyzed to calculate the average page load time over the period considered.
For example, if the average page load time is 2.5 seconds, it means that on average, your website pages take 2.5 seconds to be fully displayed by visitors. Monitoring this metric over time can help you identify any website performance issues and take corrective action to improve the user experience.
Average page load time is a quantitative metric as it provides a numerical data point that can be measured and compared over time. This metric provides an objective indication of website performance and the possible impact on user experience, allowing businesses to optimize their website for faster loading times and higher user satisfaction.
Pro tip: Choose both quantitative and qualitative UX metrics. This will provide a solid understanding of the customer’s experience with the product.
Where do we start?
It is therefore evident that ensuring an optimal user experience on a website requires careful monitoring of several key factors. Qualitative and quantitative metrics such as usability, customer satisfaction, engagement, and business impact provide a complete picture of site performance and user satisfaction.
However, one of the most critical factors that influence user experience is site performance, especially page load time. A website with slow loading times can seriously degrade the user experience and lead to increased abandonment rates and decreased conversions.
To ensure that your website provides an optimal experience to users, it is essential to closely monitor its performance and take corrective measures when necessary. If you believe your site could benefit from an in-depth analysis of its performance and user experience, we invite you to request a free web audit.
 |
Request your free web audit now!Contact us today to get a detailed analysis of your website and learn how to improve user experience and maximize your business’s online success. |
|
Request your free web audit now!Contact us today to get a detailed analysis of your website and learn how to improve user experience and maximize your business’s online success. |


