
Reading time: 16 min
Customer satisfaction has become, in recent years, one of the most widely used — and least understood — terms in the management vocabulary.
It is measured with a survey at the end of a purchase. It is included in reports as a number to display. It is mentioned in strategic presentations as proof that “customers are satisfied”. And then, most of the time, it stops there.
The problem is not that customer satisfaction is not measured. The problem is that it is measured as an end rather than as a means. And when measurement becomes an end in itself, what statistician Donald Campbell predicted back in 1976 happens — something now commonly associated with Goodhart’s Law: when a measure becomes a target, it ceases to be a good measure.
An organisation that optimises its CSAT score instead of optimising the experience that score is supposed to reflect is not improving customer satisfaction. It is improving a number.
This guide starts from a different premise: customer satisfaction is a business metric — not a survey, not a departmental KPI, not a contractual requirement. It is one of the earliest and most reliable signals an organisation has about the health of its customer relationships, the likelihood of renewal and recommendation, and the sustainability of future growth.
Understanding how it works, how to measure it correctly and how to turn it into operational decisions is a strategic capability — not a technical issue to delegate to customer service.
Contents
- What customer satisfaction really is
- Why it directly impacts revenue
- The three key metrics: CSAT, NPS and CES
- The customer journey as a satisfaction map
- How to collect feedback effectively
- From data to action: the ACAF cycle
- Customer satisfaction by industry
- Mistakes that invalidate your data
- The Kiosk solution
1. What customer satisfaction really is
Customer satisfaction measures the extent to which a customer’s expectations are met — or exceeded — throughout their experience with an organisation.
This definition sounds simple. It isn’t.
The critical word is “expectations”. Satisfaction is not an absolute property of an experience: it is the relationship between the experience a customer actually has and the experience they expected.
A customer with low expectations who receives an adequate service may be completely satisfied. A customer with high expectations who receives an objectively good service may be dissatisfied.
The same product, the same service, the same touchpoint — radically different satisfaction scores.
This relativity has an important practical consequence: managing customer satisfaction also means managing expectations, not simply improving service delivery.
But there is an even deeper level. Customer satisfaction is not a moment — it is a process. It cannot be measured through a single touchpoint: it is built (or destroyed) throughout the entire sequence of interactions a customer has with an organisation, from first contact to after-sales support, from the digital experience to the physical one, from frontline staff to automated systems.
This is why customer satisfaction is not a departmental metric. It is a system-wide metric — and it can only be improved sustainably when the entire organisation reads it, interprets it and acts on it in a coordinated way.
Customer satisfaction is not what you think you provide. It is what the customer perceives they receive. The gap between these two perspectives is often the source of every problem.
2. Why customer satisfaction directly impacts revenue
Customer satisfaction is not a “soft” indicator of business health. It is directly and measurably connected to revenue, margins and growth.
Churn and retention
Acquiring a new customer costs, on average, 5 to 7 times more than retaining an existing one. A 5% increase in retention can generate a 25% to 95% increase in profits — a wide range, but the direction is unequivocal across industries and studies.
Customer satisfaction is one of the most reliable predictors of churn: dissatisfied customers often do not communicate their dissatisfaction — they simply leave. 91% of dissatisfied customers who do not complain do not return.
Customer Lifetime Value
A satisfied customer stays longer, buys more frequently and tends to expand their relationship with the organisation over time. Customer Lifetime Value — the total economic value a customer generates throughout their relationship with a company — increases non-linearly with satisfaction: it is not a 1:1 relationship, because trust and familiarity reduce transaction costs and increase the likelihood of repeat purchases.
Word of mouth as a multiplier
A satisfied customer brings in other customers — without acquisition costs. A dissatisfied customer drives many more away.
Research into word-of-mouth asymmetry shows that a negative experience is shared, on average, with 2 to 3 times more people than a positive one. In the age of online reviews, this effect is amplified and permanent.
NPS as a predictor of growth
Organisations with a Net Promoter Score above their industry average grow at more than twice the rate of their competitors.
Amazon, Apple, Airbnb and Tesla — all companies with structurally high NPS scores — have demonstrated that customer satisfaction is not simply a consequence of growth: it is one of its causes.
The cost of dissatisfaction
Dissatisfaction generates direct costs that often remain invisible: complaint management, efforts to recover lost customers, reputational damage, and the impact on the conversion rate of new prospects who read negative reviews.
These costs are rarely aggregated and attributed to customer satisfaction — resulting in a systematic underestimation of the value of managing it.
3. The three key metrics: CSAT, NPS and CES
There are dozens of metrics for measuring customer satisfaction. Three of them cover most of the use cases relevant to organisations and are supported by solid methodologies and established benchmarks.
They are not alternatives: they complement one another and measure different dimensions of the same reality.
CSAT — Customer Satisfaction Score
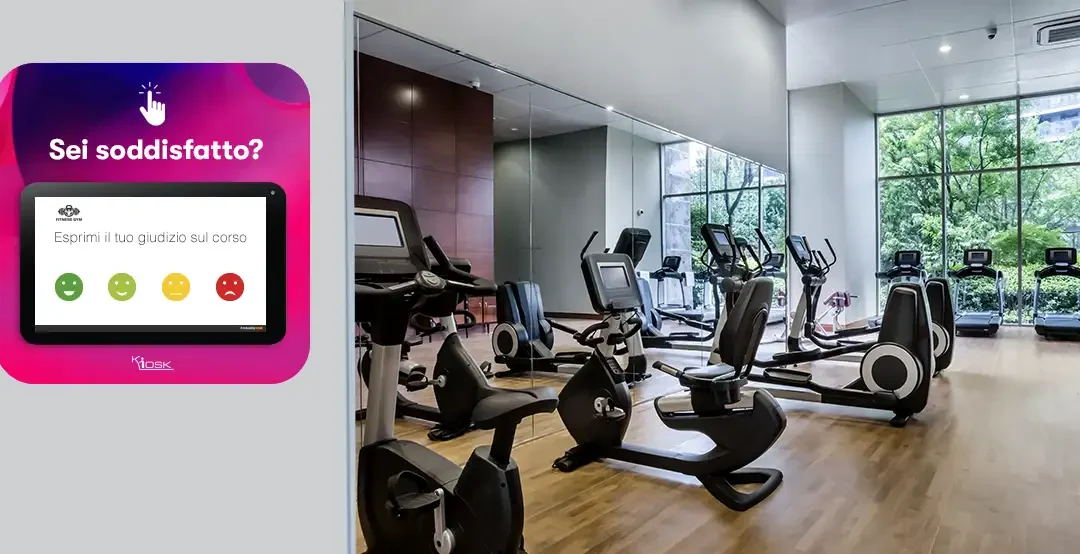
CSAT measures satisfaction with a specific interaction. A typical question is: “How would you rate the service you received today?” on a scale from 1 to 5 (or using emoticon icons, which reduce friction and increase response rates). The score is calculated as the percentage of positive responses (4 and 5) out of the total number of responses.
It is the most immediate and versatile metric and is particularly suitable for measuring individual physical touchpoints — reception desks, service counters, checkout areas and waiting rooms. Its strength is its specificity: it measures exactly that interaction, at that moment. Its limitation is the same specificity: it says nothing about long-term loyalty or the likelihood of recommendation.
The optimal time to administer it is immediately after the interaction — not hours or days later, because recall bias rapidly reduces data quality. A kiosk or tablet positioned at the exit of a service point is an ideal tool for CSAT measurement in physical environments.
→ Further reading:
- How to measure customer satisfaction: CSAT, NPS and CES
- Customer satisfaction surveys: tools and methods
- Instant surveys with emoticons: how they work
NPS — Net Promoter Score
NPS measures the likelihood that a customer will recommend an organisation to a friend or colleague, on a scale from 0 to 10. Respondents are divided into three categories: Promoters (9–10), Passives (7–8) and Detractors (0–6).
The NPS score is the percentage difference between Promoters and Detractors — and can range from -100 to +100.
NPS does not measure satisfaction with a single moment: it measures overall trust in the brand and the willingness to transfer that trust to others. It is the metric most closely correlated with organic growth and long-term churn.
Companies with an NPS above 50 consistently show growth rates above the average for their industry.
A low NPS does not tell you where to intervene — it tells you there is a problem somewhere in the journey. This is why it is always used in combination with open-ended questions inviting respondents to explain their score, and with CSAT at individual touchpoints to identify the source of dissatisfaction.
→ Further reading: How to measure NPS: a practical guide
CES — Customer Effort Score
CES measures how easy it was for a customer to complete an interaction: finding information, booking a service, solving a problem or completing a purchase. A typical question is: “How easy was it to complete this task?” on a scale from 1 to 7.
The logic behind CES is counterintuitive compared with the “customer delight” paradigm: reducing effort increases loyalty more effectively than exceeding expectations through excellence. A customer who did not have to struggle to get what they wanted is more loyal than one who received outstanding service after a frustrating experience.
According to CEB, 96% of customers with a high-effort experience show reduced future loyalty.
CES is particularly relevant in service processes — bookings, check-ins and customer support — where operational friction is a major source of dissatisfaction.
→ Further reading: How to measure customer satisfaction to improve retention
4. The customer journey as a satisfaction map
No single metric is enough to understand an organisation’s customer satisfaction. The reason is structural: satisfaction is built (or destroyed) over time, through a sequence of touchpoints — each with its own logic, audience and operational variables.
The customer journey is the map of this sequence. It is not a marketing document: it is an operational analysis tool that helps answer specific questions:
* At what point in the journey is most dissatisfaction generated?
* Which touchpoints have the greatest impact on overall perception?
* Where do the physical and digital experiences contradict or reinforce each other?
* Which moment is most critical in the decision to return — or not to return?
The answers to these questions are not the same across industries or contexts.
In a hospital, the most critical touchpoint for patient satisfaction is not (only) the quality of care: it is waiting time, wayfinding, and the clarity of communications.
In a retail store, it may be the ease of finding a product or the speed of checkout. In a bank branch, it may be queue management and waiting time at the counter.
Measuring customer satisfaction without mapping the journey means collecting data without knowing where to look for the problem. It is like measuring a patient’s body temperature without knowing where the pain is.
Goodhart’s Law applies here too: if you measure only one touchpoint — typically the final one — you optimise that touchpoint while ignoring everything that comes before it. The result is an acceptable exit score alongside an overall experience that satisfies no one.
→ Further reading:
5. How to collect feedback effectively
Feedback collection is where measurement strategy meets operational reality. Three variables determine the quality of the data collected: when, where and how.
When: timing is everything
The most accurate feedback is collected immediately after the interaction — before memory deteriorates and before other events interfere with perception. This is especially true for CSAT, where recall bias is a primary source of distortion.
A questionnaire sent by email 48 hours after an experience measures something different from a kiosk positioned at the exit of a reception area: it measures the memory of the experience, filtered through the respondent’s current mood, what has happened in the meantime, and the natural selection of those who take the time to respond (typically the very satisfied and the very dissatisfied, rather than the silent majority).
Where: the right touchpoint
Not all touchpoints provide the same informational value for every objective. A questionnaire at the checkout measures satisfaction with the purchasing experience, not with wayfinding inside the store. A kiosk in a waiting room measures the perception of the wait, not the quality of the consultation received afterwards.
Mapping the touchpoints in the journey is essential for placing feedback tools where they generate useful information — not simply where they are easiest to install.
How: reducing friction increases representativeness
A long, complex questionnaire, or one administered at the wrong moment, produces a distorted sample: only customers with a very strong opinion (positive or negative), or plenty of time available, respond. The result is not representative.
The most effective tools for collecting feedback in physical environments are those with extremely low friction: one question, four options, no typing. Emoticon icons — four faces representing moods from very dissatisfied to very satisfied — further reduce the cognitive barrier and increase response rates, while still allowing CSAT, NPS and CES indicators to be calculated within the same platform.
Digital collection (email, QR code, app) is complementary rather than a replacement: it reaches different segments and allows more detailed questions, but it suffers from structurally lower response rates and the selection bias described above.
→ Further reading:
- Instant surveys with emoticons: how Kiosk Emoticon works
- Customer satisfaction surveys: tools and methods
6. From data to action: the ACAF cycle
Collecting customer satisfaction data without a structured process for turning it into operational decisions is, at best, a waste of resources.
At worst, it is counterproductive: it creates the internal perception that “we are listening to our customers” even though nothing changes — and over time it erodes the credibility of the measurement programme.
The ACAF cycle — Ask, Categorize, Act, Follow-up — is the operational framework that turns feedback into continuous improvement.
Ask
Collect feedback at the right touchpoints, with the right tools, at the right time.
As described in the previous section, data quality depends on these three variables.
A robust measurement programme is not an annual survey: it is continuous measurement, integrated into operational processes, producing data that can be compared over time.
Categorize
The feedback collected must be organised into categories that make it possible to identify patterns, priorities and trends.
Knowing that the CSAT score is 3.8 out of 5 is not enough: you need to understand which touchpoint concentrates the most dissatisfaction, at what time of day, in which type of interaction, and with which staff member or system.
Disaggregated data is more useful than aggregated data — because it makes it possible to locate the problem and assign responsibility for the intervention.
Act
Feedback only creates value when it produces action.
The action may be operational (correcting a specific process), strategic (redesigning a touchpoint), or communicative (informing customers that their feedback has been heard and explaining what has changed).
The speed of the response is itself a signal: customers who see tangible changes in response to their feedback significantly increase their loyalty.
Follow-up
Did the intervention produce the expected result? Continuous measurement makes it possible to verify whether the actions taken have improved scores at the target touchpoints.
The cycle closes and begins again: there is no final state in which “customer satisfaction has been achieved”, but rather a continuous process of listening, learning and adapting.
→ Further reading:
- How to measure customer satisfaction to improve retention
- Understanding your customers to improve customer satisfaction
7. Customer satisfaction by industry
The metrics are universal. Their applications are industry-specific. Customer satisfaction in a healthcare facility follows different dynamics from customer satisfaction in a retail store — different critical touchpoints, different drivers of dissatisfaction and different operational implications.
Retail and large-scale distribution
The main driver of dissatisfaction in physical retail is almost always operational friction: checkout queues, difficulty finding products, unavailable staff, and missing or contradictory product information.
CSAT measured at the checkout tends to overestimate overall satisfaction because it does not capture the customer’s experience of navigating and searching within the store.
An effective retail measurement programme should cover at least three touchpoints: entrance/orientation, purchase and exit.
Self-ordering systems and information kiosks, in addition to reducing operational friction, are natural feedback collection points — integrated into the customer flow without adding further friction.
→ Further reading: Exceeding customer expectations: 8 strategies
Healthcare and medical facilities
Patient satisfaction is one of the areas where customer satisfaction has the most direct implications: it affects treatment compliance, trust in the healthcare provider, the likelihood of returning and recommending the facility and, in an increasingly competitive environment between public and private healthcare providers, its ability to attract patients.
The most critical touchpoint is not clinical quality — which patients are often unable to evaluate directly — but waiting times, clarity of communication, wayfinding and the perception of being listened to and treated with respect.
The main methodological error in measuring patient satisfaction is administering the questionnaire at discharge: recall bias and a sense of gratitude for the care received systematically distort the data upwards.
Measuring satisfaction at individual touchpoints along the patient journey — check-in, waiting room, ward and discharge — produces more accurate data and more useful information for identifying where action is needed.
Further reading:
Banks and financial services
In bank branches, the main driver of dissatisfaction is waiting. Not only the objective duration of the wait, but also how that wait is perceived — which depends on the availability of information about estimated waiting times, the comfort of the waiting area and the perception of fairness in the order in which customers are served.
A queue management system integrated with digital signage — displaying the customer’s number, estimated waiting time and relevant information while they wait — measurably reduces dissatisfaction related to waiting, regardless of its objective duration.
Measuring CSAT when customers leave the service counter, combined with operational data from the queue management system, makes it possible to directly correlate waiting times with satisfaction and identify critical thresholds for staff planning.
Corporate and public administration
In corporate environments and public administration, customer satisfaction is primarily measured across reception, wayfinding and service access experiences. Reception is the most critical touchpoint: it is the first physical point of contact with the organisation and one of the factors that most strongly influences overall perception.
A visitor management system that automates check-in, notifies the expected host and reduces waiting times at reception improves both the visitor experience and that of reception staff — with a measurable impact on reported satisfaction.
8. Mistakes that invalidate your data
A poorly designed customer satisfaction measurement programme produces data that may appear reassuring when it is not — or alarming when it is not. In either case, the risk is making decisions based on distorted information.
Measuring only customers who respond spontaneously
Customers who respond to a survey are not a representative sample. People who have had an extremely positive or extremely negative experience are more motivated to respond.
The silent majority — whose experiences are average, neither exceptional nor frustrating — tends not to respond. The result is a bimodal distribution that overestimates both satisfaction and dissatisfaction, distorting the aggregate data.
Measuring the wrong touchpoint
A high CSAT score at the checkout says nothing about the customer’s experience of navigating the store, waiting times or staff availability. If the objective is to understand where to improve the overall experience, measuring only the final touchpoint is systematically misleading.
Optimising the score instead of the experience
Goodhart’s Law in action: when staff know they are being evaluated on customer satisfaction scores, they may develop behaviours that improve the score without improving the experience — explicitly asking customers to give a 5, administering the survey only to visibly satisfied customers, or verbally influencing their response.
The result is data that is structurally biased upwards and does not reflect reality.
Failing to act on the data
Feedback creates an expectation of change. A customer who completes a questionnaire and never sees anything change will stop responding — and stop believing that the organisation is genuinely listening.
Response rates to satisfaction surveys decline over time when customers do not perceive any impact of their feedback on operational decisions.
Comparing scores that are not comparable
A CSAT score of 4.2 measured on a scale from 1 to 5 cannot be directly compared with a CSAT score of 82% measured as the percentage of positive responses. An NPS measured among active customers cannot be compared with one measured across every contact in a database.
Without methodological standardisation, comparisons over time and between different business units are unreliable.
9. The Kiosk solution
Kiosk works with organisations that want to transform customer satisfaction measurement from a procedural requirement into an operational decision-making tool.
Our approach starts with the same question that guides all our projects: not “which tool should we use?” but “what information do we need, at which touchpoint, to make which decisions?”
Answering this question requires analysis before any technology is selected: mapping the customer journey, identifying critical touchpoints, defining measurement objectives for each one, and designing the collection and reporting system.
Only after this analysis can the right tools be selected — whether touchscreen kiosks, tablets at reception, QR codes on printed materials, digital integration with CRM systems, or any combination of these.
The Kiosk Emoticon platform is our feedback collection solution for physical environments: designed for maximum ease of use, it measures CSAT, NPS and CES through a four-emoticon interface that minimises friction and maximises response rates. Its centralised administration dashboard aggregates data in real time, enables comparisons across touchpoints and different locations, and generates reports ready to support operational decision-making.
But technology is the easy part. The difficult part — and the one that creates real value — is the ACAF cycle: ensuring that the data collected is read, categorised, turned into concrete actions and verified over time. This requires an organisational process, not just a tool.
The difference between an organisation that measures customer satisfaction and one that manages it is simple: the first has a number. The second has a process.
Kiosk supports organisations in both dimensions — technology and process — with the goal of building measurement programmes that produce decisions, not just reports.
Start with a conversation, not a questionnaire
If you are considering how to improve customer satisfaction measurement in your organisation, the first step is not choosing a tool.
It is understanding where the critical touchpoints are in the customer journey — the points where satisfaction is built or lost — and what information you need in order to act.
That conversation is the starting point for a measurement programme that genuinely delivers a return on investment.

Want to turn customer satisfaction into a growth tool?
Measuring satisfaction is only the first step. Real value comes when feedback is collected at the right touchpoints, analysed in real time and transformed into concrete actions to improve the customer experience.
Kiosk consultants help you design a truly effective customer satisfaction system: from customer journey analysis and the selection of measurement touchpoints to the implementation of the platform best suited to your organisation.
Book a call with one of our experts and discover how to build a customer satisfaction programme that generates decisions, not just reports.
Tell us about your project