
Market analyzes agree that satisfaction is a key indicator to measure, capable of generating a predictive meaning of the company’s performance as 91% of unsatisfied customers change supplier. Measuring customer satisfaction becomes all the more crucial if we consider that 96% of dissatisfied customers do not complain , so it leaves no warning to the company about its future behavior.
On the other hand, market research shows that loyal customers make a business grow faster than sales and marketing.
In 2017 Robert H. Yanker, partner of McKinsey & Company, calculated the costs of acquiring, maintaining and recovering a customer. A new customer, according to Yanker, costs from 5 to 10 times more than an old one, while if you want to bring back an unsatisfied customer who has gone over to the competition, the cost reaches 100 times more than what is spent on the management of a loyal customer.
In addition, a dissatisfied customer talks about their dissatisfaction or the treatment received, on average, to 10 other people. Each of these people speaks to 6 others; each of which, in turn, to other 3 …
For Brian Halligan, CEO of HubSpot and author of numerous best-sellers, the secret of Hubspot’s success is tied to this belief:
“Feedback is the breakfast of champions. If we don’t know what’s right, we can’t do more. If we don’t know what’s wrong, we can’t do better. Without customer feedback, we are doomed to fail. If we don’t know how our customers feel, what makes them tick or where they are frustrated … we will fail. “
So asking our customers for feedback allows us to understand what drives their satisfaction and if there are aspects that we need to improve to avoid losing them.
It all starts with collecting feedback from our customers.
The ACAF Customer Feedback Cycle
The strategic system for collecting and implementing customer feedback is called the “ACAF Cycle”.
Its name is the acronym of:
- A as Ask , or Asking customers for feedback
- C as Categorize , i.e. Categorize the feedback
- A come Act , or Act based on feedback
- F as Follow-up , i.e. Following up on customer requests by informing them that we are really listening to them
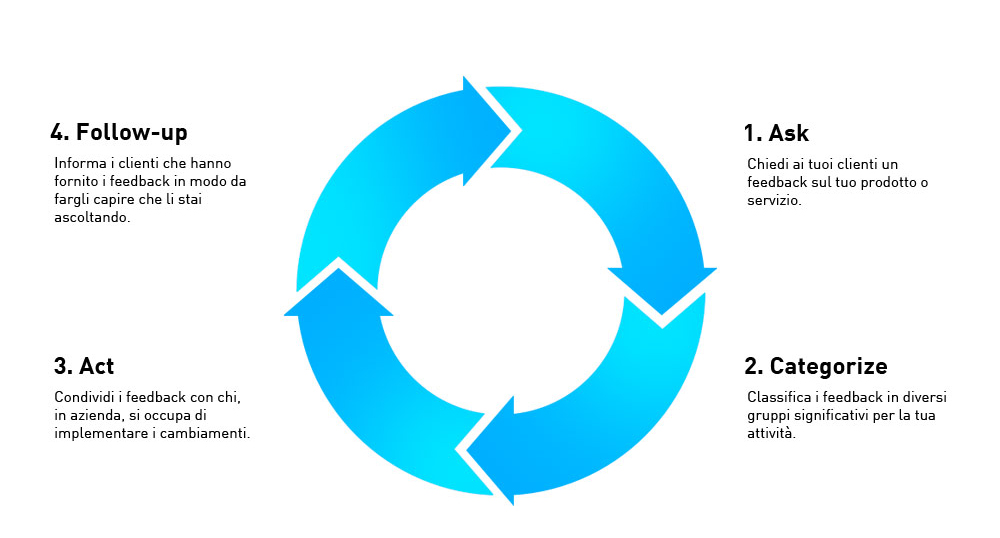
Each step of this process requires correct tools to be carried out with ease and rigor.
ASK: Ask for feedback from customers
The process for measuring customer satisfaction begins with the satisfaction questionnaire, i.e. with the request for feedback from our customers, and then asking a precise and direct question about satisfaction.
But what questions should we ask? It depends on our goals.
- Do we need to understand general trends in customer satisfaction over time?
- Should we identify customer service issues that frustrate customers?
- Do we need to discover the problems of the product in order to improve it?
Appropriate analysis procedures correspond to each objective, which we see in detail in this article.
1. Questions to understand general trends in customer satisfaction
To identify general customer satisfaction trends, we need to set up a satisfaction questionnaire that helps us first establish a baseline on how happy (or unhappy) our customers are today. So we can ask the same question at set intervals to understand how customer satisfaction changes over time. This will help us identify trends and solve new customer problems.
The most popular ways to measure general trends related to customer satisfaction are data:
- Net Promoter Score (NPS)
- Customer Satisfaction Score (CSAT)
- Social media monitoring
a) NPS or Net Promoter Score
The NPS, which stands for Net Promoter Score, is a synthetic index that is growing in popularity to measure the likelihood that a person will recommend a particular product or service. The satisfaction questionnaire consists of asking a single question with an answer on a scale of 1 to 10.
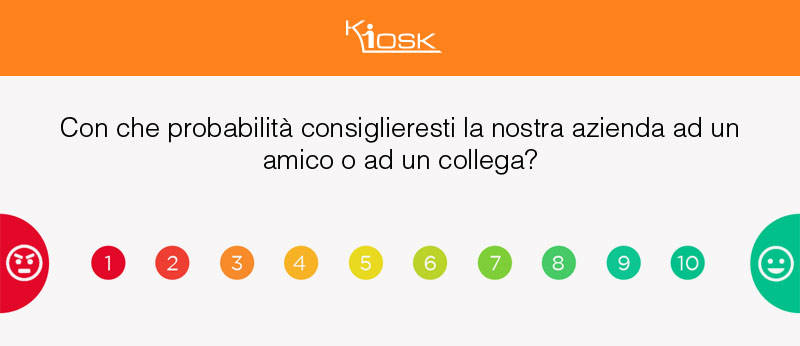
Example of an NPS survey made with Kiosk Emoticon .
Customers who choose an answer between 1 and 6 are called detractors, those who answer 7 and 8 are neutral, those who answer 9 and 10 are called promoters.
The NPS index is calculated by subtracting the percentage of detractors (customers who would not recommend you) from the percentage of promoters (customers who would recommend you).
It is commonly used as a tool for measuring customer loyalty. In fact, customers who fall into the “promoter” category tend to have a 3x to 8x higher lifetime value (LTV) than the “detractor” category.
The NPS index is therefore used as a reliable measure to predict revenue trends. According to data from Bain and Company, companies with the highest NPS in their industry tend to outperform their competitors by at least 2x.
Here are the pros and cons of using an NPS questionnaire:
| PRO | AGAINST | |
|
|
Many companies, especially in the United States, use NPS as their main metric not only to measure customer satisfaction over time but to predict the future performance of the company. In fact, the evidence shows that companies with an NPS greater than 50% will have a growth in turnover.
Eg. Amazon’s NPS is 62; Airbnb’s of 74, Apple’s 72, and Tesla’s NPS is an astounding 96.
b) CSAT or Customer Satisfaction Analysis
The CSAT satisfaction questionnaire is also based on asking a question focused on determining the level of customer satisfaction. It is a type of questionnaire that has a low impact on the customer in terms of time required to provide information and has a very high value for the company.
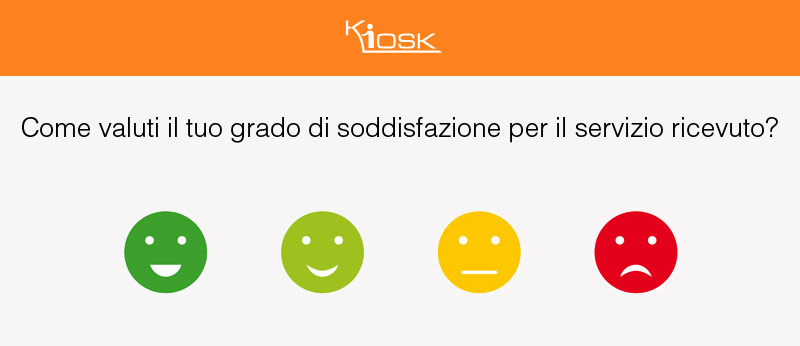
The central question concerns the degree of satisfaction with our company and therefore the CSAT score expresses how satisfied a customer is with the specific interaction with the company.
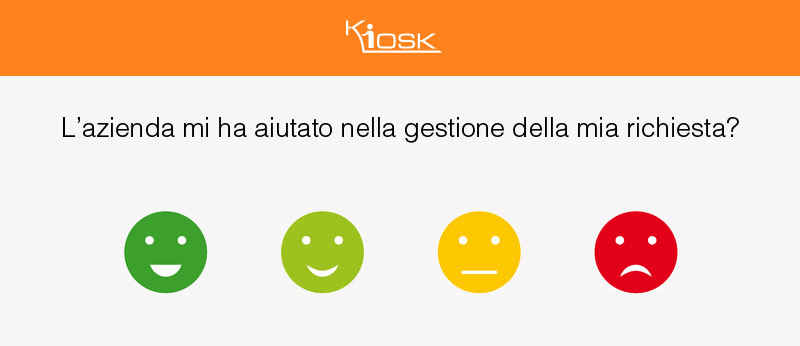
The question looks like this:

Example of CSAT Survey made with Kiosk Emoticon.
CSAT questions are often asked at the end of live chats or knowledge base articles to learn how helpful the solution has been for the customer.
Here are the pros and cons for using a questionnaire based on the CSAT index:
| PRO | AGAINST | |
|
|
c) Social media monitoring
In addition to collecting NPS and CSAT surveys, you can hear what customers are really thinking about you using tools like Google Alerts or Mention that help identify social mentions and brand forums on websites like Facebook, Twitter, Quora, Yelp, TripAdvisor and other third-party review sites.
While there isn’t a specific survey question that the customer answers, it is these means that allow you to get a general feel for what customers are saying about your company over time.
Here are the pros and cons of social media monitoring:
| PRO | AGAINST | |
|
|
Find out how Kiosk Emoticon can help you create questions to understand general trends in customer satisfaction over time by administering NPS and CSAT surveys
2. Questions to identify customer service issues that are most frustrating to customers
These are useful questions to evaluate the performance of the support service.
The customer is asked to answer questions such as: How is the customer service team doing? Are you satisfied with the service you have received? Are we offering fast and high quality service?
The most useful questionnaires to identify the satisfaction of the service provided are:
- Net Promoter Score (NPS)
- Customer Satisfaction Score (CSAT)
- Customer Engagement Score (CES)
Let’s analyze them in more detail.
a) Net Promoter Score (NPS)
As already highlighted, the satisfaction questionnaire based on the Net Promoter Score (NPS) measures the likelihood that a person will recommend your product or service.
An example of an NPS question is:
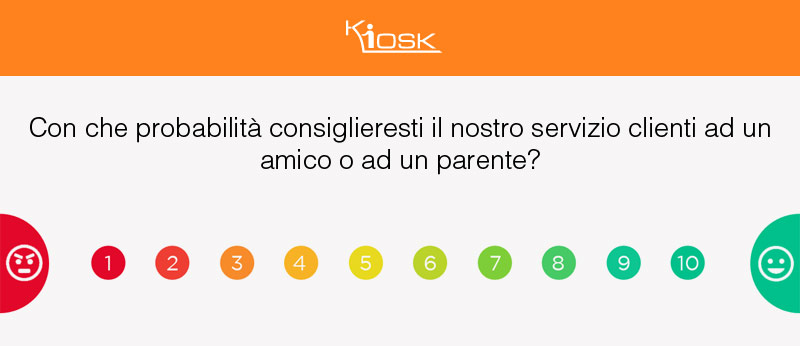
Example of an NPS survey made with Kiosk Emoticon.
Here are the main pros and cons:
| PRO | AGAINST | |
|
|
b) Customer Satisfaction Score (CSAT)
As already shown, the questionnaire based on the CSAT index measures how satisfied a customer is after interacting with the company.
An example CSAT question:
Example of CSAT Survey made with Kiosk Emoticon.
| PRO | AGAINST | |
|
|
c) Customer Effort Score (CES)
The CES survey allows you to obtain a quantitative index of the commitment required from customers to interact with the company. These interactions can be related to the effort required to use a product, to access a service or to the ease with which the customer was able to solve a problem. The importance of the CES survey is therefore related to the ability to keep the fundamental promises of the company, how to solve a problem quickly.
The reference question for this survey is:
Example of CSES survey made with Kiosk Emoticon.
The CES index therefore represents the measure of the difficulty for a user to reach a resolution of the problem. Unlike the NPS application, which emphasizes acquiring “promoters” to recommend the business to others, CES focuses on creating an “effortless experience” for customers.
Using the CES index is emphasized in a Harvard Business Review article that having a low-effort experience is one of the best ways to increase customer loyalty. According to the HBR study, 94% of customers who report low effort said they would repurchase, while 88% said they would increase spending.
Finally, according to CEB, 96% of customers with high CES scores showed reduced loyalty in the future, while this was the case for only 9% of those who reported low CES scores.
| PRO | AGAINST | |
|
|
Find out how Kiosk Emoticon can help you create questions to identify the most frustrating customer service issues by administering NPS, CSAT, and CES surveys.
The surveys described are feasible through digital methods that have as their strong point the ability to collect responses quickly and easily create a point of contact between customers and the company.
Step Two: Categorize – Categorize the feedback
The collected data must therefore be organized. We can generally divide feedback into 3 main categories:
- Product feedback
- Customer service feedback
- Marketing and sales feedback
If the data collection was successful, only a specialized program is able to process the information and organize it in a short time in order to create easily intelligible reports. Otherwise you will need to compile and manipulate data in spreadsheets and run pivot tables which and VLookup which take a long time to analyze trends.
Step Three: ACT – Acting on Feedback
The results should then be shared with
- Product team
- Customer support team
- Marketing and sales team
Experts recommend sharing the results in order to act on the advice received.
Step Four: Follow – up with customers
According to research by an independent group in the UK, 43% of customers do not leave feedback because they don’t think the company really cares what customers think. The data highlights that 81% of customers would be willing to leave feedback if they knew they would get a quick response.
It therefore becomes a vital element to make our customers feel appreciated for their feedback, both positive and negative. Only in this way will they collaborate with us by providing us with other feedbacks and therefore other elements for improvement.
 |
Do not waste time. Schedule a live demo.Find out how Kiosk Emoticon allows you to measure the satisfaction of your customers and support the growth of your business. Book a live demo and find out in detail. |
|
Would you like to know more?Find out how Kiosk Emoticon allows you to measure the satisfaction of your customers and support the growth of your business. |


